
Motivation
As per the WHO guidelines an abnormal CXR is an indication for full diagnostic evaluation. All patients with unexplained findings suggestive of TB on CXR should be evaluated for TB with a bacteriological diagnostic test. CXR can be used as a supplementary diagnostic aid, although the specificity is low. A bacteriologically confirmed diagnosis is always preferred. (more about WHO recommendations and policies can be found in “THE END TB STRATEGY” by WHO).
There is need to innovate with approaches such as electronic and mobile health. Integration of artificial intelligence into new software has a promise to make processes more effective and efficient. Users can benefit from artificial intelligence software for predicting TB from chest X-rays (CXR). An artificial intelligence solution to interpret X-rays for presence of TB in a cost-effective way could expand the reach of early identification and treatment of TB in developing nations.
Data Sets:
U.S. National Library of Medicine has made two datasets of chest radiographs available - the Montgomery County chest X-ray set (MC) and the Shenzhen set. These datasets are in de-identified form. The MC set contains 138 frontal CXR from Montgomery County’s Tuberculosis screening program, of which 80 are normal cases and 58 are cases with manifestations of TB. The Shenzhen set contains 662 frontal CXR, of which 326 are normal cases and 336 are cases with manifestations of TB. Both the MC and Shenzhen datasets collectively form the TB dataset.
Montgomery+Shenzen Dataset
| Images | Count | Normal |
|---|---|---|
| Montgomery | 58 | 80 |
| Shenzhen | 336 | 326 |
NIH Dataset
Chest-X-ray-14 is currently the largest publicly available chest X-ray dataset, containing over 100k frontal view X-ray images with 14 diseases. This dataset does not include TB but it can be useful in the analysis to see how the classification generalizes from TB to other pathologies.
| Pathology | Count | Pathology | Count |
|---|---|---|---|
| Atelectasis | 11535 | Hernia | 227 |
| Cardiomegaly | 2772 | Infiltration | 19870 |
| Consolidation | 4667 | Mass | 5764 |
| Edema | 2303 | Nodule | 6323 |
| Effusion | 13307 | Plueral Thickening | 3385 |
| Emphysema | 2516 | Pneumonia | 1353 |
| Fibrosis | 1686 | Pneumothorax | 5298 |
We also obtained data from other a local hospital I have summarized it below.
DMH Dataset
| DIOCOM IMAGES | Count |
|---|---|
| # of images | 29639 |
| total size | 459.9GB |
| PNG Images | Count |
|---|---|
| # of images | 29631 |
| total size | 138.9GB |
These data did not contain the column ‘service’ indicating type of image. These data also did not contain radiology reports.
| Type | Count |
|---|---|
| Other | 3,641 |
| Blank | 5,237 |
| Lungs | 20,753 |
| Images not converted | 8 |
Since radiology reports were not available for many images identified as TB from Electronic Health Records, we got selected sub-set of data reviewed by expert radiologist who identified 262 images as having evidence of tuberculosis.
After identifying and verifying radiology reports, we selected 2180 Chest-rays which had ‘No abnormality’ thus creating a data set of 2442 images which were used for tuning and validation.
Selection of Classification Model
Image Features Selection
Features are measurable characteristics of an image. Selection of relevant features helps in selecting simple and robust classification models. Human-engineered features require prior knowledge and human effort in feature design.
Convolutional neural network (CNN) is a deep learning technique that has been proven to be a very powerful tool such as in Imagenet classification. CNN can learn relevant and extensive set of features automatically using convolution layers. It has been widely successful in image classification and can outperform conventional models. The features extracted using CNN can be supplied to a simple classification model such as logistic regression.
CNN in TB Prediction
The success of CNN models in recognizing objects in natural images has spurred interest in applying deep learning to medical images as well. There has been a lot of research in applying these models for machine learning of medical diseases. A couple of selected approaches that can be promising in TB classification are briefly outlined here.
TX-CNN proposes a novel method using CNN to deal with unbalanced, less-category X-ray images. The method is reported to have improved the accuracy for classifying multiple TB manifestations by a large margin.
CheXNet is implementation of an algorithm that can detect pneumonia from chest X-rays at a level exceeding practicing radiologists. It is a 121-layer convolutional neural network trained on Chest-X-ray-14 Dataset. The article reports that CheXNet exceeds average radiologist performance. This article has been widely discussed and because of several similarities, it can be used for TB classification. Motivated from this research, the proposed approach for TB classification can be based on one or more deep CNN models such as AlexNet, ResNet, DenseNet, Inception, etc.
Transfer Learning
Training deep CNN models requires a huge dataset of labelled images. The available TB X-ray dataset is miniscule in comparison. The CXR dataset is small in size and specific.
Transfer learning is a commonly used technique to deal with this problem. A model pre-trained on a very large dataset can be picked up. Only the selected outer layers of the model can be trained for CXR images while retaining the pre-trained weights of the earlier layers. This way the inner layers of the models extract features related to general images because of their training on other large image dataset. The outer layers filter from these features those that are more relevant to CXR.
Classification Performance
We tried out a step by step approach, we first tried classify TB vs Normal(helthy images). We got a fair performance. We then tried out TB vs Non-TB as most patients who take their X-rays often have other ailments if not TB, we got fantastic results for this one. We suspected that due to different sources of the datasets the classification modelwas picking up on something. TB was taken from Shenzen and Montgomery, and Non tB images were taken from(NIH) the model performed really well. So to verify our hunch we tried out Cardiomegaly(enlargement of heart) Classification, using data drom same source, we also generated heatmaps of where the source of the problem could be. The results were fair, the heatmaps were great beacuse they did localize on the heart. So our model was working great but was overfitting due to source. We worked in 2 Phases
Phase I
- A) TB Vs Normal
- B) TB vs Non-TB
- C)Cardiomegaly Vs Non Cardiomegaly + Heatmap generation
Phase 2
- D) Screening model integration
- E)Mixed Data Tuning and Results (Final Model)
In the Phase 2 we also added a Screening model that could differentiate between X-Rays and Non X-Rays.
We then tuned the model using mixed data( data from DMH and trained the model.) I have sumarized the results below A) Initially a model is trained only on the TB dataset. The objective is to ensure that a model can be developed to classify TB vs Normal cases successfully.
| Label | Count |
|---|---|
| TB | 54 |
| Count | 336 |
Following are the Results
| Metric | Score |
|---|---|
| Sensitivity | 82.28% |
| Specificity | 95.12% |
| PPV(Positive Predictive value) | 77.58% |
| NPV(Negative Predictive value) | 84.78% |
| F1 | 87.84% |
| AUROC | 94.16% |
| Accuracy | 88.88% |
B) The TB dataset has TB positive and normal cases. In real life, patients will not only be normal or TB positive. Patients with other pathologies are likely to come for screening for TB. It is necessary to evaluate TB classification performance when other chest pathology x-rays are included in the dataset. X-rays from Chest-X-ray-14 dataset are included to perform analysis of TB vs Non TB cases.
| Label | Count |
|---|---|
| TB | 394 |
| Count | 3652 |
| Metric | Score |
|---|---|
| Sensitivity | 82.28% |
| Specificity | 98.22% |
| PPV(Positive Predictive value) | 83.33% |
| NPV(Negative Predictive value) | 98.09% |
| Kappa | 80.96% |
| F1 | 82.80% |
| ROC AUC | 98.68% |
| Accuracy | 96.67% |
C) The sources of TB dataset and Chest-X-ray-14 datasets differ. It is likely that this difference helps a classification model to classify the TB cases successfully. To ascertain that the model can perform even when the x-rays are from the same source, a model is evaluated for Cardiomegaly vs Non Cardiomegaly classification using the Chest-X-ray-14 dataset. Next we tried Cardiomegaly vs Non-Cardiomegaly. Cardiomegaly is abnormal enlargement of heart. This analysis does not include any cases from the TB dataset.
D) The results of C, were promising and I integrated the Screening model in our application You can view a demo here. Besides, the above results the model could screen the data from RSNA bone images and MRI Images. I never used them for training or testing, this was truly novel data. The model was also able to screen blurry images with a prompt on whether the User would like to proceed to predicting Tuberculosis on the X-ray Image anyway.
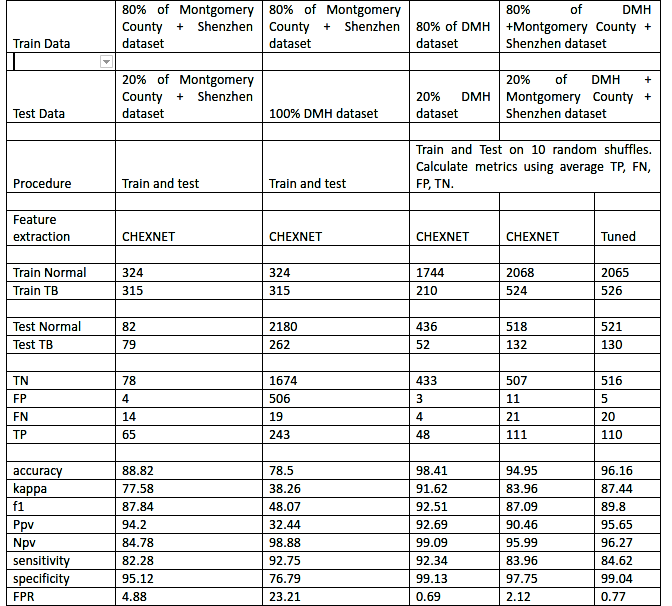
E) The next logical step was to use multiple sources of data (Montgomery, Shenzen as well as DMH) to train and test the model. Hence, we tried the mixed models approach
The results were good. Ultimately, the model has to work on ANY source of reasonably good chest X-Ray. Therefore, we chose the last model and tuned it for better performance.
Comparative results for model selection are given below.
The screening model and the final model were integrated in the Application.