
Recently I was given an assignment at work, where I had to generate Segmentation Mask from Ultrasound Images.As I was reading through the articles, I came across this paper
I was asked to compute average dice-coeffcient as my error metric, but after reading the paper I came across Three Error Metrics.This article is solely dedicated to those metrics.
Pixel Error
The simplest way of evaluating a segmentation is by measuring the pixel error between the original labels and the segmented ones. Let li denote the value of the boundary labeling L at image location i. The pixel error of L with respect to another binary labeling L* is the number of pixel locations at which the two labelings disagree. This can also be written as the squared Euclidean distance || L1 - L* || which is equivalent to the Hamming distance since the labels are binary-valued.
![]()
It is overly sensitive to minor displacements in the location of a boundary that are ubiquitous. These disagreements cause no qualitative differences in the interpretation of the image, but can lead to large quantitative differences in pixel error.
Warping Error
If L* can be transformed into L by a sequence of pixel flips that each preserve a set of desired topological properties occur only at locations within a mask M, then we will say L is a warping of L*, or L <| L. The first condition constrains L and L to be topologically equivalent. The second condition can be used to constrain L to be geometrically similar to L*. Both conditions will be explained in more detail below.
Now consider the pixel error of T relative to warpings of L*. The warping error between some candidate labeling T and a reference labeling L* is the Hamming distance (or equivalently squared Euclidean distance) between L and the “best warping” of L* onto T:
D(T || L*) = min(L <| L*) || T-L ||2
In other words, the warping error between two segmentations is the minimum mean square error between the pixels of the target segmentation and the pixels of a topology-preserving warped source segmentation.
A major practical goal of digital topology is to identify methods of altering the geometry of objects within a digital image without altering any topological properties of the image. A simple point is defined as a location in a binary image at which the pixel can be flipped to its complementary value without changing any topological properties of the image. These properties include, for example, the number of k-components of the foreground and the number of k bar-connected components of the background.
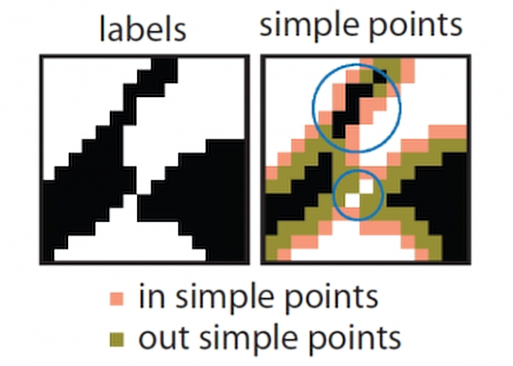
In short, by definition flipping a simple point is a topology-preserving operation and flipping a non-simple point is not topology-preserving. Non-simple points can be classified by the nature of the topological change they would cause by being flipped. The possible topological changes are
- splitting,
- merging,
- hole addition/deletion,
- or object addition/deletion.
Rand Error
Rand Error is where things get interesting, turns out it is pretty similiar to the Dice coefficient with a minor difference
The Rand index is a well-known measure of the similarity between two data clusterings. Recently, it has been proposed as a measure of segmentation performance, since a segmentation can be regarded as a clustering of pixels. More formally, define a segmentation as an integer-valued labeling of an image. Each object in a segmentation consists of a set of pixels sharing a common label.
The Rand index is defined as a measure of agreement:
Given two segmentations S1 and S2 of an image I with n pixels, we define:
- a, the number of pairs of pixels in I that are in the same object in S1 and in the same object in S2 (i.e., they have the same label)
- b, the number of pairs of pixels in I that are in different objects in S1 and in different objects in S2 (i.e., they have different labels)
The Rand index, RI, is:
where n is the total number of pixels in both the segmentations, where the denominator is the combination of choosing any 2 pixels over total number of pixels n.Essentially it is, nC2
The dice coefficient is given as:
where |X| and |Y| are the cardinalities of the two sets. Since the denominator is the total number of pairs, the Rand index represents the frequency of occurrence of agreements over the total pairs, or the probability that |X|and |Y| will agree on a randomly chosen pair.
It is the harmonic mean between the above two sets. Here is the formula
Side notes
- The Dice coefficient is also the harmonic mean of Sensitivity and Precision, to see why it makes sense, read Why is the F-Measure a harmonic mean and not an arithmetic mean of the Precision and Recall measures?.
Harmonic mean is used in places where a simple arithmatic mean fails. For example, if we have a large number of outliers in our data, Harmonic mean is a better fit as it gives a truer value of the central tendency of the population(data points).
Dice coefficient is closely related to F1 score. In the F1 score we need to assess a trade-off between the Recall(Sensitivity) and Precision. On closer study of their formulae
In the image above look at the Sensitivity and PPV values they have same numerator but different denominator, so using harmonic mean is appropriate since it takes the reciprocal of the values. We also get a truer mean unaffected by outliers by taking Harmonic Mean