
Motivation
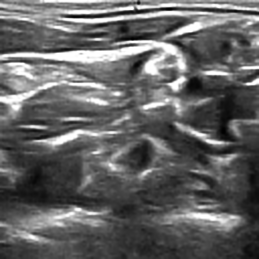
Most people are afraid of any surgery due to discomfort and significant pain associated with it apart from the risks involved. Various pharmacological and non-pharmacological modalities are in use for pain management. Evidence suggests that more than half of patients who undergo surgery report inadequate pain relief. Many times multimodal regimens are recommended to manage pain and peripheral nerve block is increasingly used as part of pain management. Peripheral nerve block is a type of regional anaesthesia in which a small hollow plastic tube (catheter) is placed under the skin into the space containing the nerves that provide sensation of pain to the area of interest. Correct placement of the needle is of utmost importance in this procedure. One of the risks of this technique is vascular puncture. To reduce the risk of vascular puncture, ultrasound is used to guide the needle. Accurately identifying nerve structures in ultrasound images is a critical step in effectively inserting a patient’s pain management catheter.
Nerve Segementation using AI
Given an image we need to find the corresponding mask which indicates the nerve location in that image. This problem can be casted as a supervised image segmentation problem where precomputed masks serve as labels for the ultrasound image data. Here, the goal is to build a classification model at pixel level where probability of each of the pixels belonging to the segmented mask is predicted. Below is an example of a typical image segmentation problem for cells data captured under microscope.
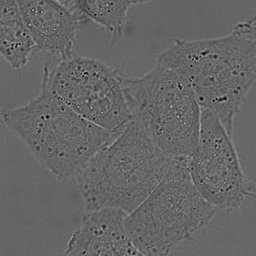
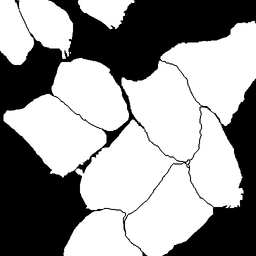
HeLa cells on glass recorded with DIC (differential interference contrast) microscopy. (left) raw image. (right) segmentation mask indicating cell locations (white:foreground, black:background).
In our application we trained the deep learning model on a dataset of ~5000 ultrasound images and their masks, and then generated masks for new test images to evaluate the model’s prediction performance. We computed the effectiveness with dice-coefficient. The Dice Coefficient (DICE), also called the overlap index, is the most commonly used metric in validating medical volume segmentations, in addition to the direct comparison between automatic and ground truth segmentations.
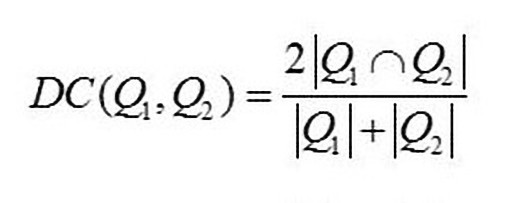
Where |Q1| and |Q2| are the number of instances in the two samples being compared
Below are the example images from this project:

U-Net architecture for Image-Segementation
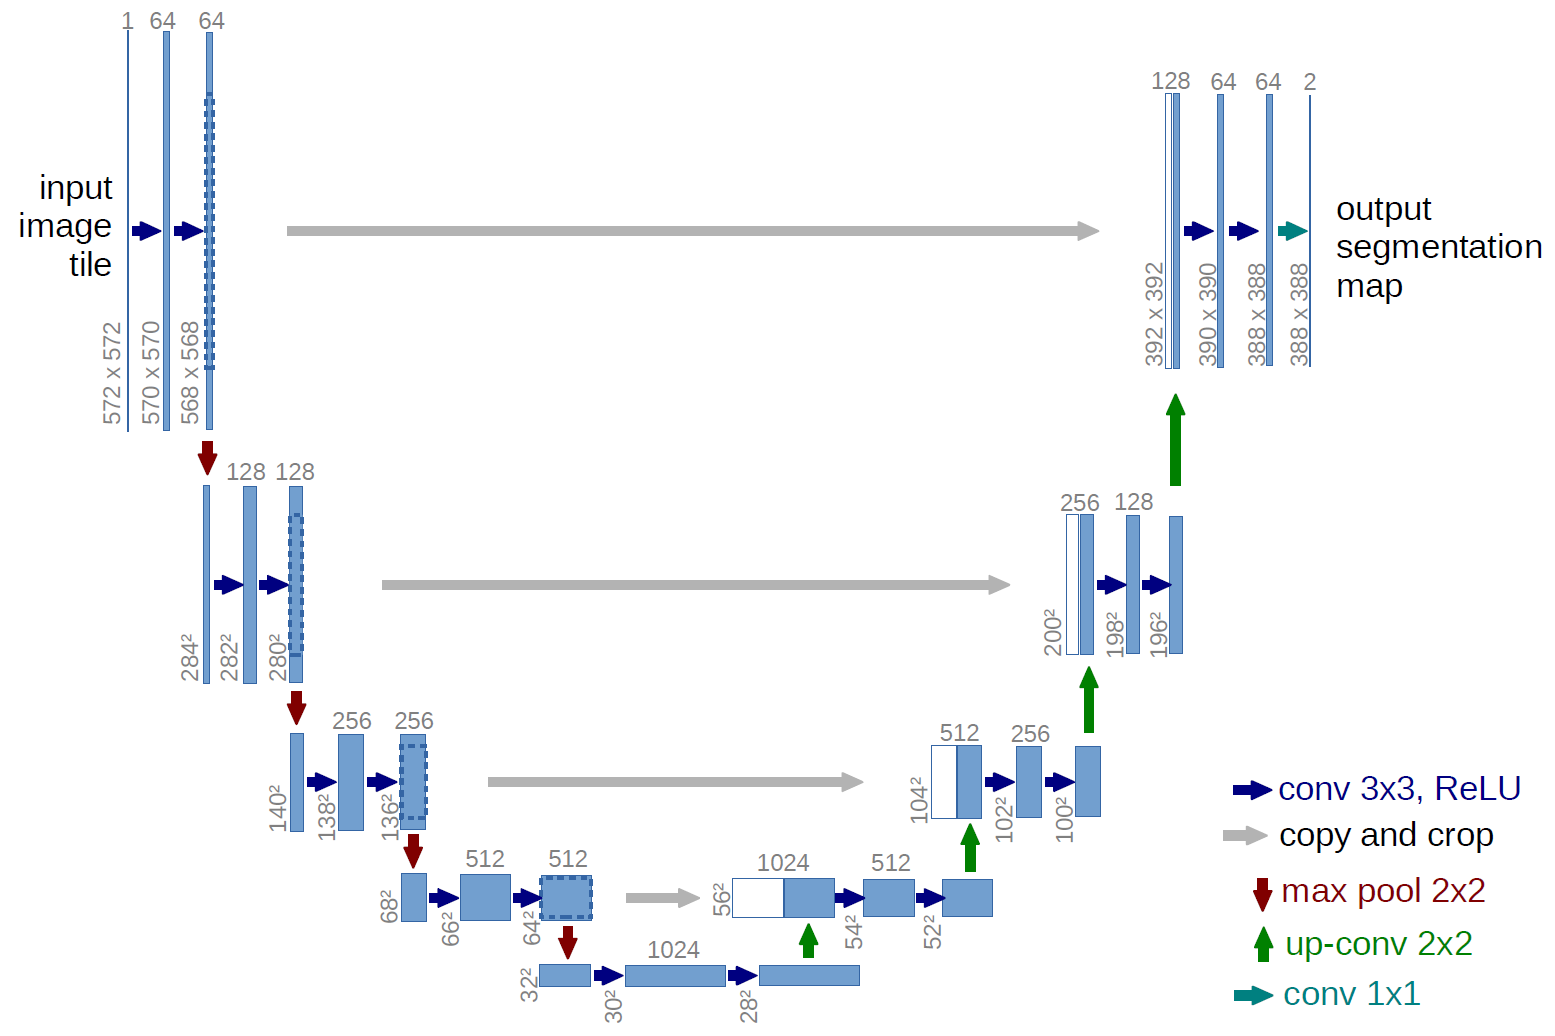
Advantages
- In this architecture, the network is input image size agnostic since it does not contain fully connected layers.This also leads to smaller model weight size (for 512x512 U-NET - ca. 89mb)
- Can be easily scaled to have multiple classes
- Relatively easy to understand why the architecture works, if you have basic understanding of how convolutions work
- Architecture works well with small training set, thanks due robustness provided with data augmentation
Disadvantages
- The architecture initially was designed to overcome the ad hoc choice of ‘rolling window’ / patches hyper-parameters. To have decent results the size of U-NET that you will be using must be comparable with the size of features and its surroundings (i.e. you should include some context for the model to work properly)
- Because of many layers takes significant amount of time to train
- Relatively high GPU memory footprint for larger images:
- 640x959 image => you can fit 4-8 images in one batch with 6GB GPU
- 640x959 image => you can fit 8-16 images in one batch with 12GB GPU
- 1280*1918 => you can fit 1-2 images in one batch with 12GB GPU
Results
This model is evaluated on the mean Dice Coefficient. The Dice Coefficient can be used to compare the pixel-wise agreement between a predicted segmentation and its corresponding ground truth. The formula is given by:
where Q1 is the predicted set of pixels and Q2 is the ground truth. The Dice coefficient of 0 indicates no similarity and that of 1 indicates exact match between the ground truth and predicted mask. We got a dice score of 0.6834 on test data.
I recommend reading the Next Post, to dive deeper into the evaluation metric.